I saw something in a paper which didn't make much sense to me... Of course it is also possible that I’m
just stupid and overlooking explanations... so I’ll write here what I found and
you can decide on your own.
This is a
table I reproduced from that paper. The reason I don’t simply make a screenshot
of the table in the paper is that I could be false. And in that case I don’t
want to falsely accuse the paper (or its authors) of error.
So I tried
to provide some anonymity to the paper… (for now).
Pre are
measurements taken before... something... and post afterwards (if you didn't guess it).
The same
people were tested in pre and post and the sample size was 21.
What
surprised me were the tiny standard deviations for some of the Variable 1 and 2,
especially in combination with the range given.
So I tried
to find some numbers that would fulfill the criteria given (mean, standard
deviation and range) for these 4 (or 8) variables. First my "results" for the first four
variables pre:
As you can
see I managed to find values (for each participant) that add up to the given
mean for every variable. (I should note here that the third and the fourth
variable are ratings on a numerical (not visual) rating scale, so values other
than other than X.0 and X.5 might not be so likely.)
I also tried to get the SD
as much to the given value as possible. You see what I was able to get.
(SD excel
is the SD calculated by excel and SD me is the SD calculated by me with help of
excel, i.e. I set up the formula myself cos I didn’t know what formula excel
was using. I didn’t calculate it by hand though, because there would be no chance
to get a correct result that way.)
The SDs
(dark blue row) I got are much higher than the given SDs for the first two
variables (variable 1 pre and 2 pre).
I don’t
know, obviously there’s a chance that I’m just dumb and didn’t do it correct.
In order to get a lower SDs than those I got, I then replaced these numbers (for 2 to 20) with the mean of the
first and the last value. I can’t change the first and the last value, because
they are given in the table. Obviously, when I do that the mean is not "correct"
anymore, but I should get the
lowest possible SD (min and max value fixed) with that, shouldn't I?
Apparently, for
the first two variables the SD is still a lot higher than the given SD. (For
the third and fourth variable I was able to get the same (very close, but I
could have tried longer) SD as given in the table anyways.)
In the next
table you can see that this is similar for these variables in post:
Just for
the variables 1 and 2 (pre and post) I couldn’t find any values that met the
criteria.
So I thought maybe the authors inadvertently reported the SEM instead
of the SD. Maybe it is possible to call the SEM SD because after all the SEM is
a measurement of deviation which is standardized too.
Therefore I tried to get the SEM to be the value reported for the SD:
That is
possible for the first to variables (pre and post) but I didn’t manage to do
that for the third and fourth variable.
Maybe they
reported the SEM for Variable 1 and 2 and the SD for Variable 3 and 4. I don’t know. The other possibility is that
I made a mistake, obviously.
Anyways… in
the paper they did t-tests with these variables. So I tried
to do that too… Obviously I don’t know in which order the values were… so
if I just take my fabricated values I get a far off t-value.
Sorry for my SPSS speaking German, but it isn’t important
anyways (as it is obvious that this gives the false t-values):
At least I
saw some significances in that output window for once… :(
And mean,
SD and SEM are about the same as in my Excel calculation.
Fortunately
the paper tells me which t-values I ought to get:
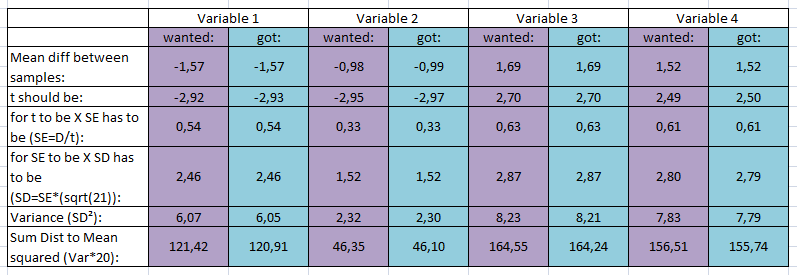
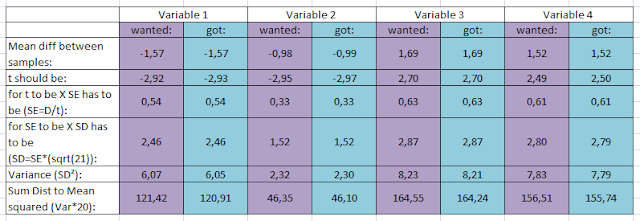
So I
calculated what the Sum of the (distance to the mean)² of the differences
between the two conditions (pre and post) needs to be in order to get
* the
"correct" mean difference between the samples
* and therefore also the "correct" t-value.
Here’s a
table for that:
Then I
tweaked my… why not call them "data" ("data" not: data) to fit these criteria.
Although I
was not able to reproduce exactly these numbers, it went quite well and I got
pretty close.
Obviously there are a lot of solutions, especially if I don't meet the SD-criteria for each Variable as specified in the table (I could have tried for the 3rd and 4th variable, but I didn't).
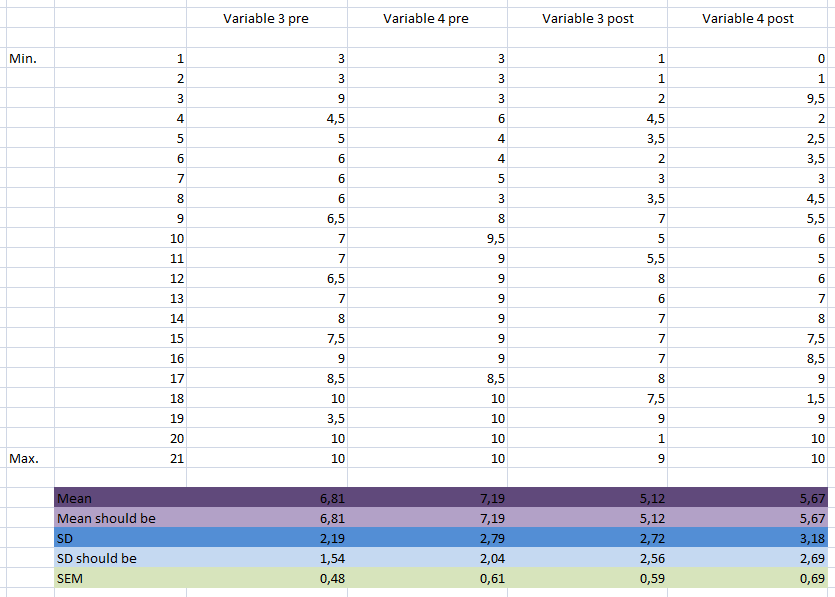
 Here (one possible set of ) the individual "data" I used to get this values:
Btw, I
gained some data-fabrication knowledge doing this (which I had not previously had!! All my
data are honestly p-hacked :( :( ).
Want to hire me?
SPSS too thinks that the new t-values are much better:

I know this might seem like a really small point... since the t-values are all possible and hopefully correct. I don't know. It's relevant for effect-size estimation, for example.
I can be false (just to say this again, because maybe I'm not seeing something really obvious).
Another point I noticed is that they report a mean of 0.36 (SD=0.29) in some questionaire data. I can't say anything about this, since I don't know their participants personally, but seriously... I doubt it.
I found this graph which represents the answer-distribution for a non-clinical population for either this scale or a quite similar one (it's not clear to me from the paper; there is a long and a short version):
The reported mean for that scale (out of that other study) is 9.4 with a SD of 7.83). My participants (healthy controls) have a mean value of 12.4 (with min=4, max=19, and SD=3.5). Of course the mean can be lower (then there) in different populations at a different time and if especially people with probably low values in that questionaire are recruited. But 0.36 seems really low to me.
I don't know if they did some transformations on that or whatever, but it is not reported.
Oh, and even though I obviously didn't report a lot of varibles/values from that study I didn't omit a control group... it's just pre and post.
(Again, I don't exclude my stupidity at all. Sorry for the repetition.
I thought very long about whether or not to post this, but I think the SD and the mean of the questionaire are too low...)